By Jo Kwon
What are StoryMaps?
ArcGIS StoryMaps is an interactive, collaborative, and accessible storytelling tool that combines narrative, maps, and multimedia to create engaging and informative experiences displayed on a webpage. ArcGIS StoryMaps is effortlessly sharable and viewable across a range of devices, including computers, tablets, and smartphones. It also aligns with Web Content Accessibility Guidelines, ensuring accessibility for all users. While ArcGIS StoryMaps offers numerous benefits, it also has some drawbacks, such as limited multimedia capabilities and restricted design options.
StoryMaps in Urban Planning
StoryMaps can be a powerful tool for creating effective planning visualizations. Visualizations play a pivotal role in planning because they have real consequences and often result in tangible action. Plans, with the support of strong visualizations, communicate visions that inspire communities, provide agendas that enable commitment, establish policies that automate decisions, and offer designs that consider outcomes and strategies that take into account interdependent actions (Hopkins 2001; McClendon et al. 2003). Visualizations offer opportunities for improved communication throughout the planning process (Metze 2020; Eppler and Platts 2009).
Here are some examples of how StoryMaps are being used in the urban planning field:
The Vulnerability of Historic Structures in Nantucket, MA (2023) by Elizabeth Mitchell
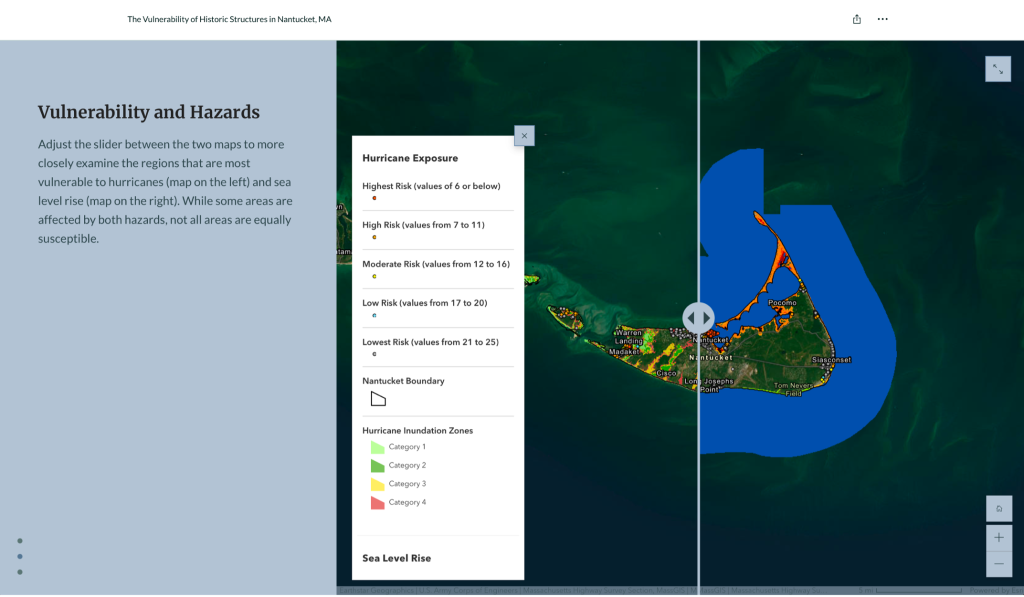
This StoryMap was made for a Duke University course on Coastal GIS (Geographic Information Systems). Elizabeth analyzed Nantucket’s historic structures to identify those most vulnerable to sea level rise, and conducted a simple analysis to recommend structures that Nantucket may want to prioritize protecting.

StoryMaps use a swipe block to visualize two different layers of data side by side. In this project, the StoryMap visualized hurricanes and sea level rise exposure together. This function allows users to compare the two layers and see how they overlap. To learn more about the swipe block, visit this website.
Mapping Impervious Surfaces (2021) by Lauren Caffe
Lauren mapped impervious surfaces in Camden, Maine, using remote sensing to map the percentage of impervious surface per parcel for a small coastal community that is susceptible to sea level rise and intense rain events. Her suggestions for improving stormwater management and promoting sustainable growth in Camden are presented at the end of the StoryMap.

StoryMaps can be customized like other websites, presenting different text styles and media. The example above also shows how quote blocks can be used. To learn more about customizing StoryMaps, visit this website.
Feel Free (To Be Cost Burdened) (2021) by Deanie Anyangwe, Katie Hillis, Pierce Holloway, Jo Kwon, Eve Lettau, Justin Nolan, Lauren Prunkl, Henry Read, Duncan Richey, & Marielle Saunders
This StoryMap was created for the Zoning for Equity course, offered across six US graduate planning schools and awarded a 2023 curriculum design award from the Lincoln Institute of Land Policy. It discusses zoning reform in Carrboro, North Carolina, and the policies that Carrboro has implemented to address this issue. However, the StoryMap also suggests that more efforts are needed.

StoryMaps’ express map function enables users to add points and create narratives for specific locations, including extra information. To learn more about the express maps, visit this website.
Assessing Savannah (2020) by Katie Burket, Eve Lettau, & Sam Stites
This StoryMap was created for a project in Urban Spatial Structures, a course offered at the University of North Carolina at Chapel Hill. It assesses Savannah, Georgia, discussing its history, demographics, transportation, industries, climate change, and offering policy recommendations.

The sidecar function creates an immersive experience by allowing users to slide horizontally, changing the narrative from vertical. With this tool, different narratives can be told, such as the diverse history of Savannah’s transportation. To learn more about the sidecar function, visit this website.
The Use of GIS for the Adaptive Reuse of Historical Sites: A Study of the Durham Belt Line Trail (2018) by Jo Kwon
This StoryMap was created as a project for a Master’s thesis at Duke University. The project examines the evolution of urban redevelopment, presents relevant studies of adaptive reuse, delves into Durham’s tobacco history, and discusses a digital trail of the Durham Belt Line Trail (now Durham Rail Trail) that reflects a comprehensive narrative of the city’s past, present, and future.

3D models and 3D billboards of 2D photographs can be incorporated into StoryMaps to enhance the storytelling experience. While the digital billboards contain 2D images, their inclusion allows viewers to gain a perspective of the buildings and trails from an actual person’s viewpoint, adding a human-scale element to the visuals. Moreover, comparing digital billboards across different years and examples creates an analogous experience that facilitates understanding and comparison. To learn more about 3D objects in StoryMaps, visit this website.
Citations
Eppler, Martin J., and Ken W. Platts. 2009. “Visual Strategizing.” Long Range Planning 42 (1): 42–74. https://doi.org/10.1016/j.lrp.2008.11.005.
Hopkins, Lewis D. 2001. Urban Development: The Logic Of Making Plans. Washington DC: Island Press.
McClendon, Bruce W, Ernest Erber, Margarita McCoy, and Israel Stollman. 2003. “A Bold Vision and a Brand Identity for the Planning Profession,” 13.
Metze, Tamara. 2020. “Visualization in Environmental Policy and Planning: A Systematic Review and Research Agenda.” Journal of Environmental Policy & Planning 22 (5): 745–60. https://doi.org/10.1080/1523908X.2020.1798751.

Jo (Joungwon) Kwon is a Ph.D. candidate in the Department of City and Regional Planning, driven by a deep interest in exploring the applications of visualizations in planning. Since joining CPJ in 2019, she has worked actively as an editor. With a diverse academic background in Statistics and English Literature, she holds an M.A. in Computational Media from Duke University. In her free time, she enjoys watching indie films, attending live performances, pursuing climbing adventures, and drinking a good cup of coffee.
Edited by Kathryn Cunningham
Featured image: ArcGIS StoryMaps. Photo Credit: https://storymaps.arcgis.com

